
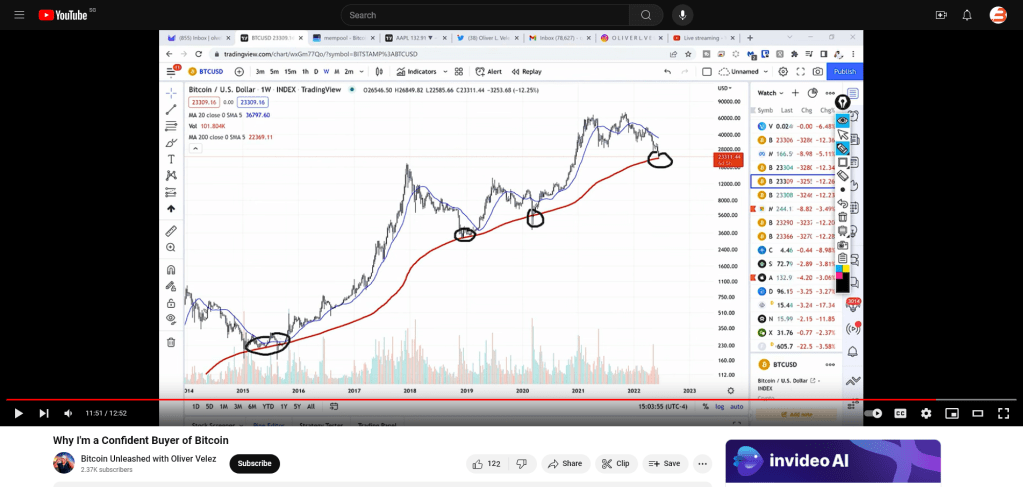
I was randomly watching some Bitcoin tutorials on YouTube and stumbled upon a video by trader Oliver Velez. He highlighted a very remarkable observation: Bitcoin is currently touching the 200-week moving average. This caught my attention because the last time Bitcoin touched this key technical indicator was during the COVID-19 pandemic. Historically, this has been a huge buy signal for many traders. I had already set a few buy limit orders a few weeks back, anticipating a potential drop in Bitcoin’s price to a low level. To my surprise, these orders were fulfilled.
Understanding the 200-Week Moving Average
For those unfamiliar, the 200-week moving average (WMA) is a long-term trend indicator used by traders to analyze the average closing price of Bitcoin over the past 200 weeks. It’s considered a critical support level. When Bitcoin’s price approaches this line, it often signals a significant buying opportunity, as seen in previous market cycles.
Conflicting Data
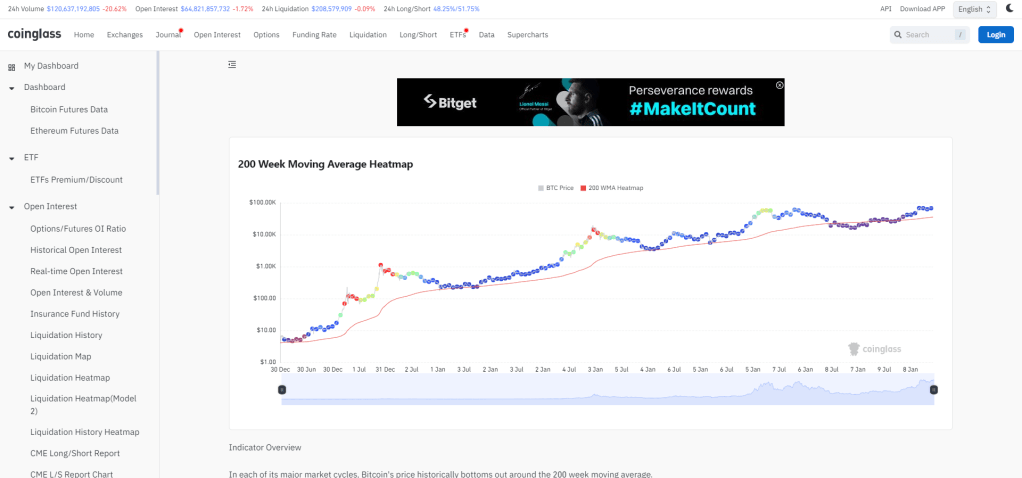
However, I noticed something curious when I checked the 200-week moving average data on Coinglass. Their numbers showed different results. Can anyone explain why in the comments if you know why?
Personal Strategy and Dry Powder
I still have some dry powder left, so I’m planning to set even lower limit buy orders. For those new to the term, “dry powder” refers to cash reserves kept on hand to take advantage of investment opportunities.
This isn’t financial advice, but personally, if I run out of liquidity, I might consider taking out a small, manageable FIAT loan to buy more Sats (satoshis, the smallest unit of Bitcoin). In my case, apart from giving my wife monthly money and covering essential expenses, all my salary from my full-time job goes straight into Bitcoin. Instead of saving FIAT money in a bank, I convert it to Sats. I’m all in, bro!
Technical Insights
To add more context, the 200-week moving average has historically acted as a strong support level for Bitcoin. During the 2018 bear market, Bitcoin bounced off this level, signaling a bottom and the start of a new bullish phase. Similarly, during the March 2020 crash caused by the COVID-19 pandemic, Bitcoin briefly touched this moving average before skyrocketing to new all-time highs.
Market Sentiment and Strategy
Market sentiment plays a crucial role in trading decisions. The touching of the 200-week moving average often indicates a shift in sentiment from bearish to bullish. It’s a point where long-term investors see value and start accumulating more Bitcoin, anticipating a future price increase.
Conclusion
As always, investing in Bitcoin carries risks, and it’s essential to do your own research and consider your financial situation before making any decisions. For me, the strategy has been to consistently buy Bitcoin, especially when it touches significant support levels like the 200-week moving average. This approach has worked well so far, and I’m excited to see where it takes me next. Happy investing!


Leave a comment